You can upload any image, I suggest googling dashcam traffic lights, or use one of the images below. Images should be smaller than 4mb and should be .jpeg, .bmp or .png.
The Shortest Route To A Demo
This demonstration was inspired by the job description for a freelance role I recently applied for. The project involved recognising faults with traffic lights and I wanted to see how quickly I could develop an end-to-end computer vision system that recognises and labels traffic lights.
This is a relatively simple solution which prioritized speed, simplicity and low costs. I used the free tier of the Azure Custom Vision service to train and deploy the model. The model is trained to recognise and label traffic lights.
Summary
- The model is hosted on Azure Custom Vision on the free tier
- The model is trained on ~4500 images
- Images are part of the DriveU Traffic Light Dataset
To improve the model I would:
- Use many more images
- Experiment with different model architectures
- Tune the hyper-parameters
Method
-
Find a good dataset. It would have taken too long to create my own labelled dataset so I needed to find a freely available set of labelled images. It turns out there are several to choose from. Waymo have a huge dataset that is freely available but I chose to use the DriveU Traffic Light dataset instead. It’s well documented, easily accessible and good enough.
-
Convert the images - the DTLD images are 16-bit .TIFF images. I needed .JPEG or .PNG images. I first converted the 16-bit .TIFF images to 8-bit, and then converted them to .JPEG. The DTLD dataset contains more image data and metadata than I needed so I simply ignored or stripped out what I didn’t need.
-
Parse the label data to extract only the information I needed. The DTLD dataset contains labels that specify the location of the traffic lights in the images as well as the type of traffic light and what phase the lights are in. I was only interested in the location of the lights for this demo. I needed to convert the coordinates of the regions from absolute to relative.
-
Create a Custom Vision project, create custom tags, and upload pairs of images and labels in the required form. The documentation was good enough and whilst there were a few steps that were unclear.
I was able to quickly figure out what to do, usually by clicking around to try a couple things and check the results. Each cloud platform has its own quirks and design concepts, and once you’ve understood the pattern you can develop a good intuition for how each platform (in this case Azure) “wants” you to do something.
-
Train the model. There aren’t many options to choose from and the dataset wasn’t very big.
-
Use the model to make predictions.
-
Create a simple UI on a static site (this page) using JavaScript and HTML. The JavaScript Fetch API is used to query the Custom Vision API. jQuery and some custom (vanilla) JavaScript is used to parse the results and create the interactive elements on the page.
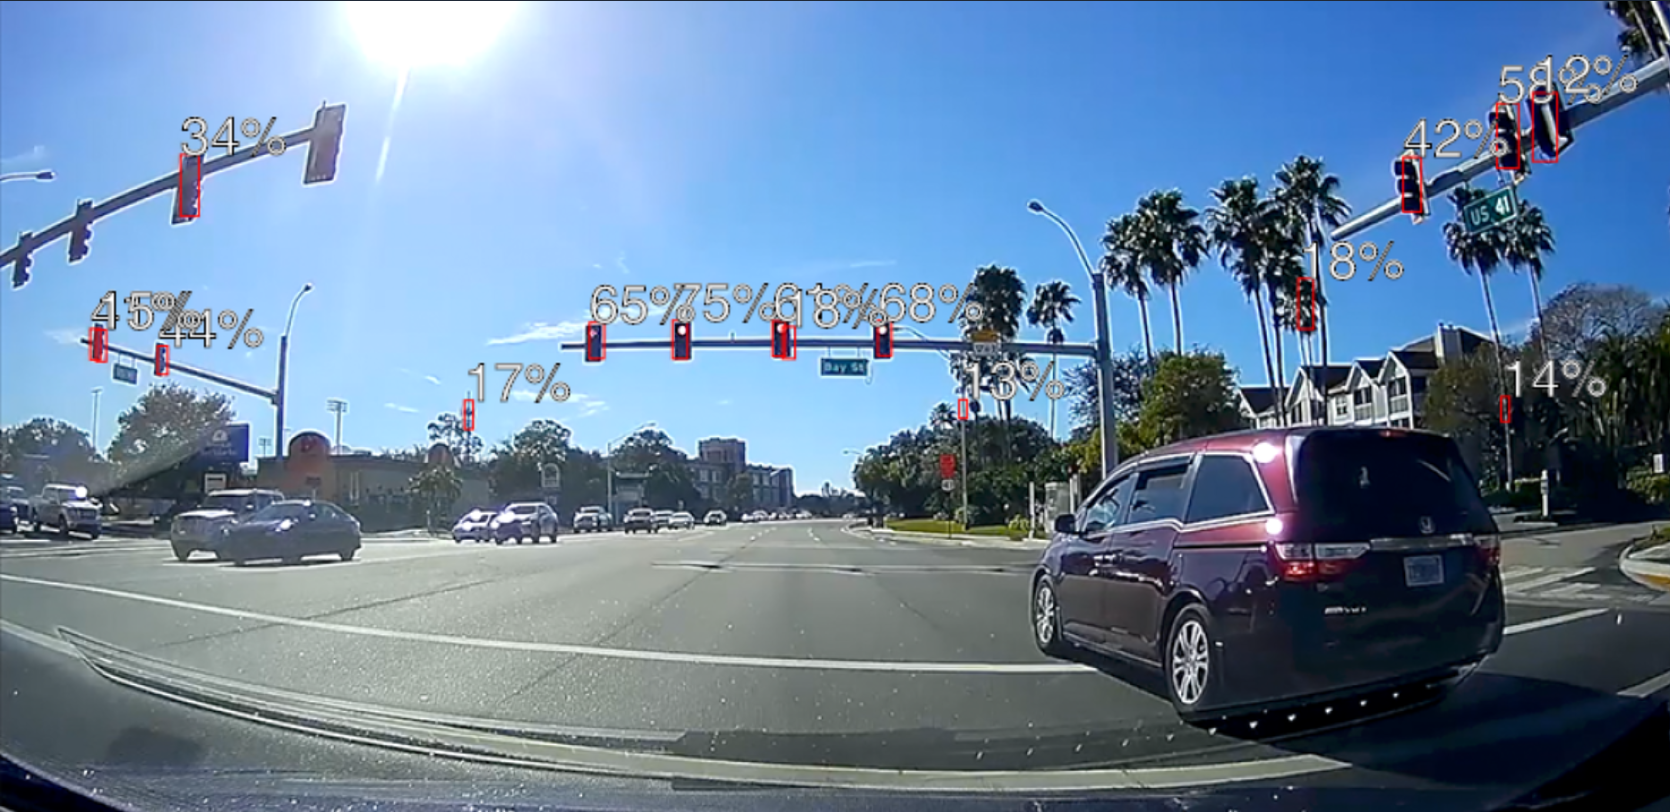
The model’s results are shown by overlaying an HTML
canvaselement on top of theimgelement that shows the image that’s been uploaded by the user. The regions and probabilities are drawn using HTML Canvas methods (strokeRect,fillTextetc).
Next steps:
-
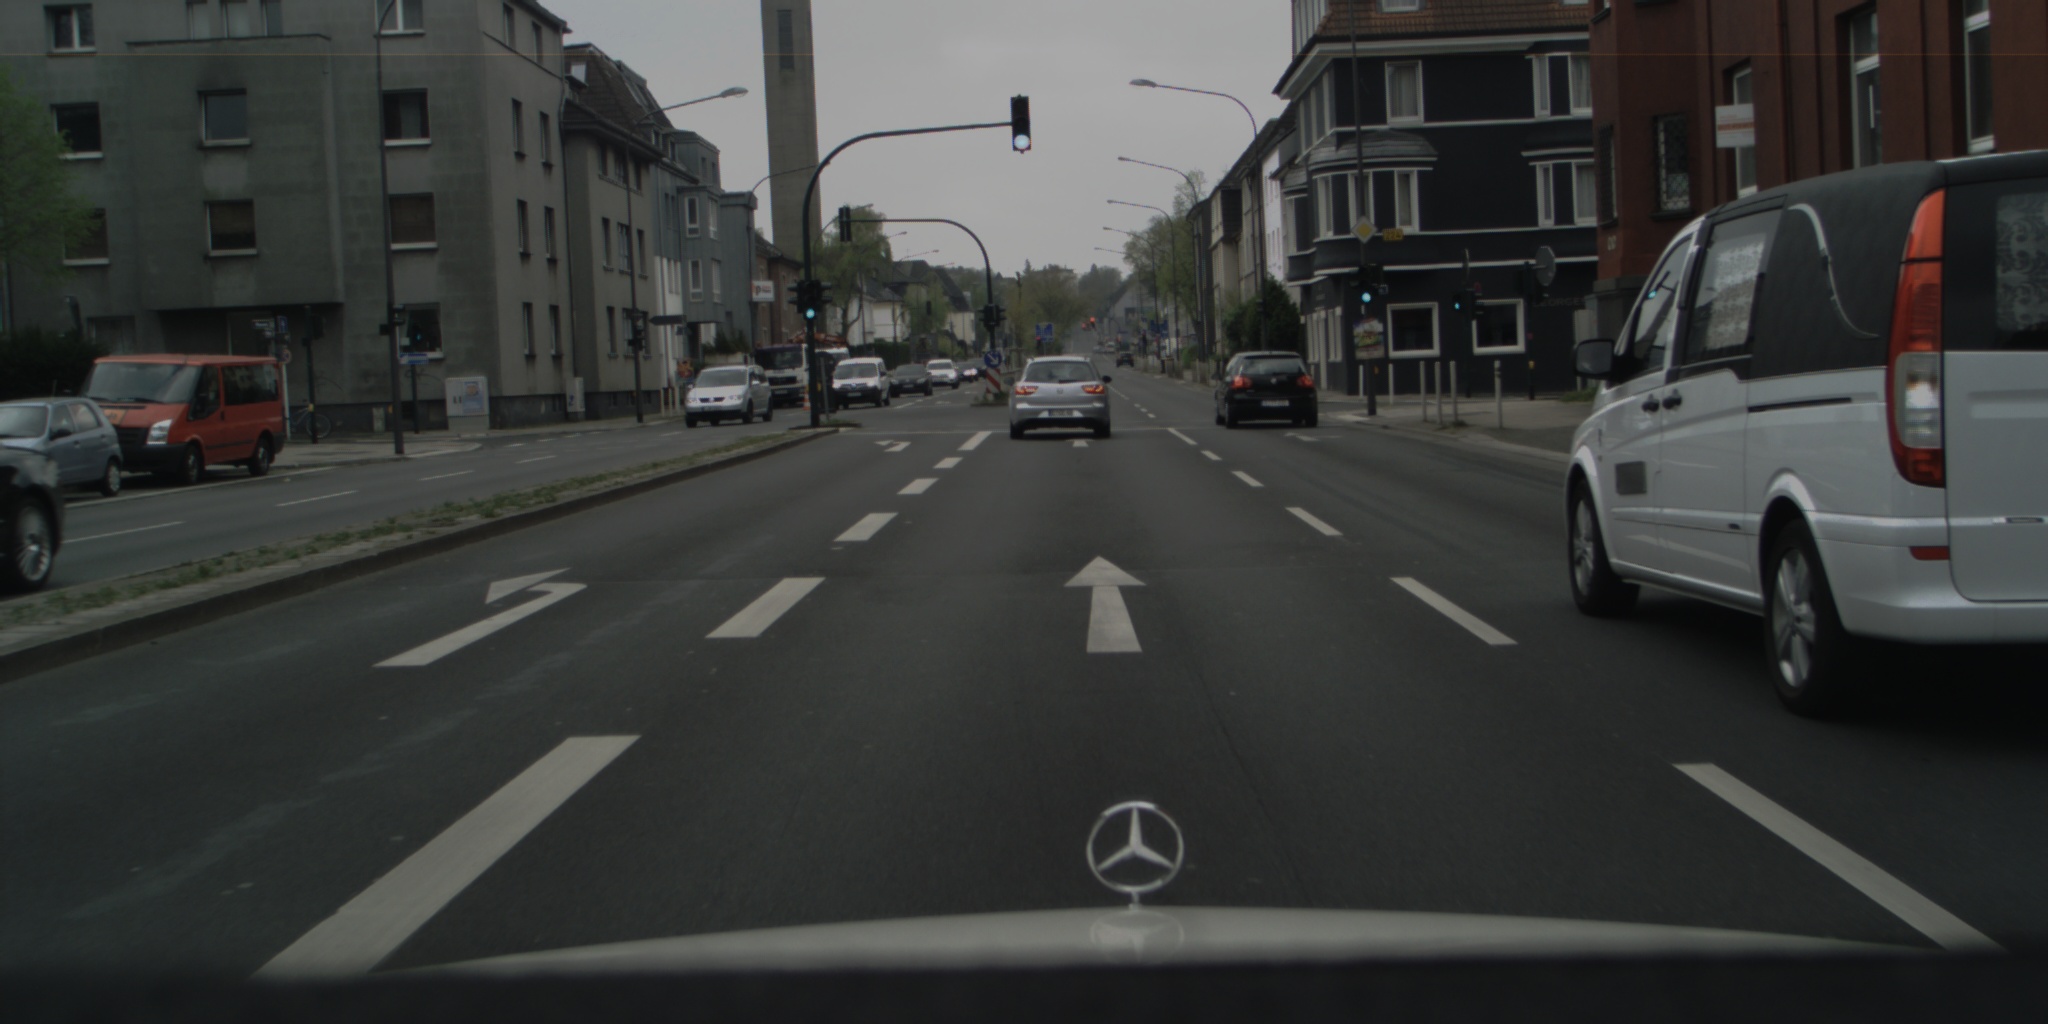
The model is trained on images from German Cities. In order to generalise the model it should be trained using images from a wider distribution. This could include:
- Rural and urban settings.
- Views from footpaths as well as roads.
- Different weather conditions.
- Different cities and countries.
-
It would be nice to let the user adjust the minimum probability threshold. Currently only results with a probability above 10% are shown.
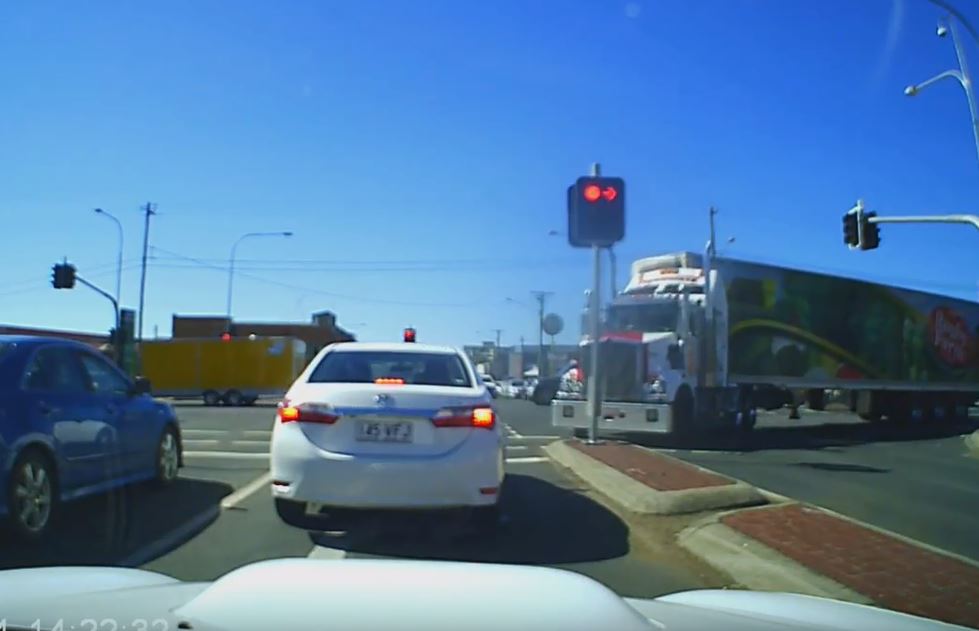
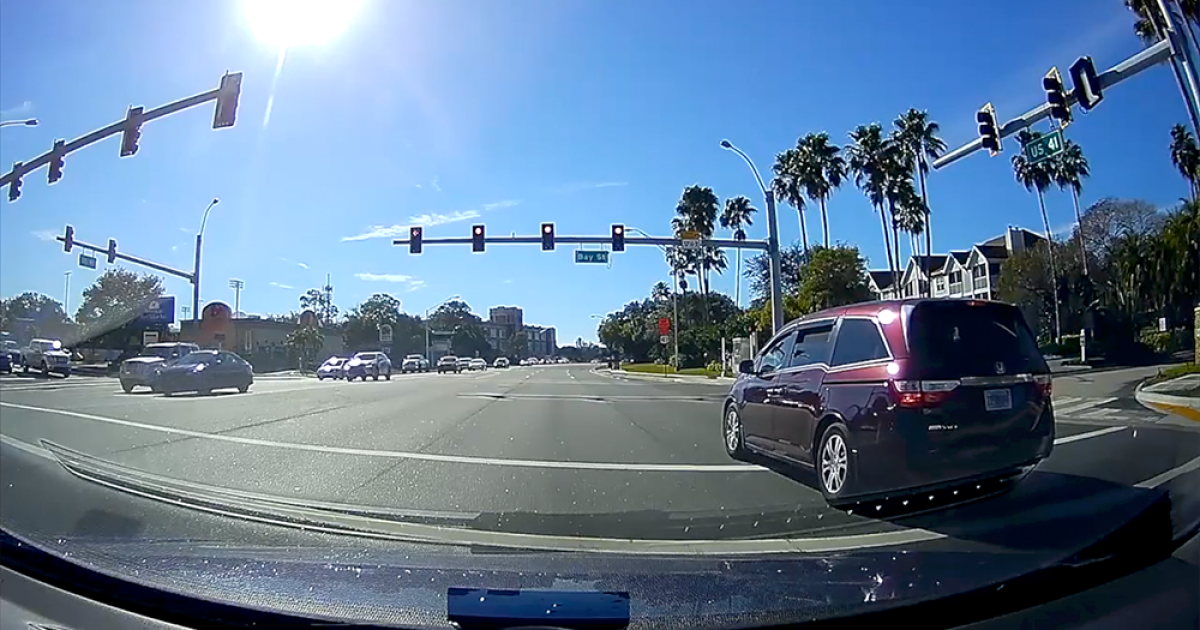
Test images:
You could use these images to test the model. You’ll need to store them locally before uploading.